


Table of contents
- Create a database for a blogging application.
- Create a Remote user for the Ghost Application.
- Configure MySQL for remote access.
- Create a VPC and Subnet on Google Cloud.
- Configure IPsec VPN between GCP and AWS cloud.
- Create a single node VPC Native GKE Cluster.
- Create a DNS hostname.
- Preparing and publishing our Ghost Helm Chart.
- Deploying Load-Balancer.
- Installing the Ghost application.
- Adding DNS record at the domain registrar.
- Spin up a new EC2 on AWS.
- Download and Install The Zabbix Repository.
- Install Zabbix Server, Frontend, and Agent.
- Create an Initial Database.
- Login and Configure the Zabbix Server Front end.
- Install Zabbix Agent on the same Zabbix Server.
- Create host items.
- Configure MySQL monitoring.
- Install Grafana and configure it to interface it with Zabbix.
- Reference
This is the First time that I am blogging, hashnode has provided this wonderful platform to blog.
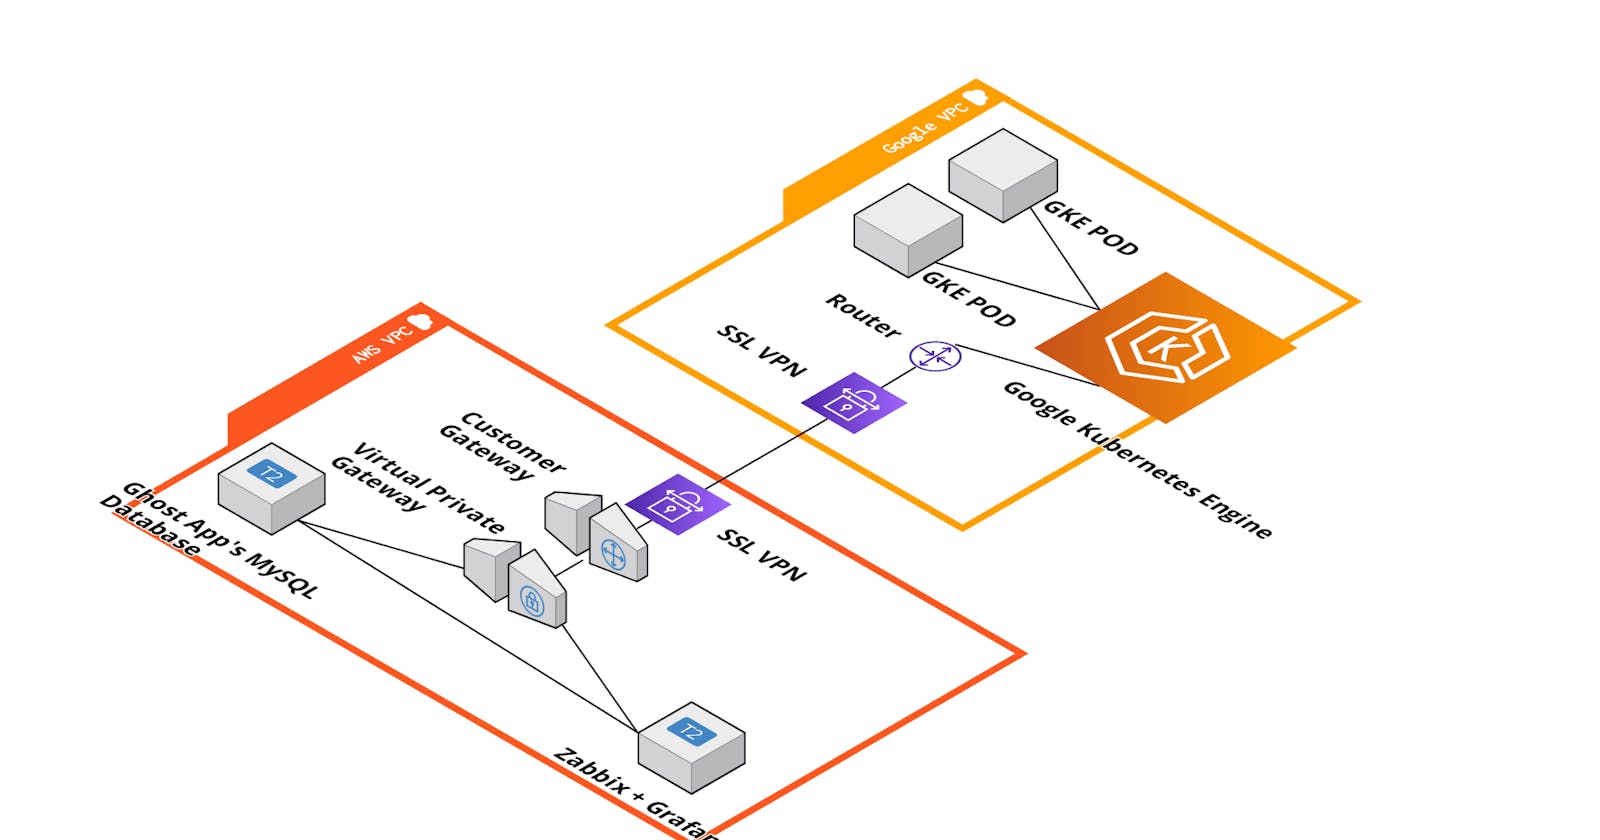
This is a demonstration of hosting a blogging application "Ghost" on the managed Kubernetes - GCP's GKE. The end goal of this blog is to represent how I implemented this in a multi-cloud environment of AWS and GCP.
I used the AWS EC2 instance and installed the MySQL database for the Ghost app. Then established SSL VPN between my AWS VPC and Google VPC. Once the connectivity was established, I further went ahead and installed the Ghost App on the Kubernetes cluster using Helm Charts. Next, I spun up a new EC2 Instance in AWS in the same VPC and Installed Zabbix and Grafana on it to monitor the Database server - As we know in the SRE domain, how important monitors can be , we live and breathe alerts !!!!
Pre-requisite
MySQL should be installed on the EC2 instance.
Knowledge of using VIM Editor, SQL, Networking, and VPN.
Hands-on practice of AWS & Google Cloud.
Create a database for a blogging application.
Login into Ubuntu VM.
Run the command
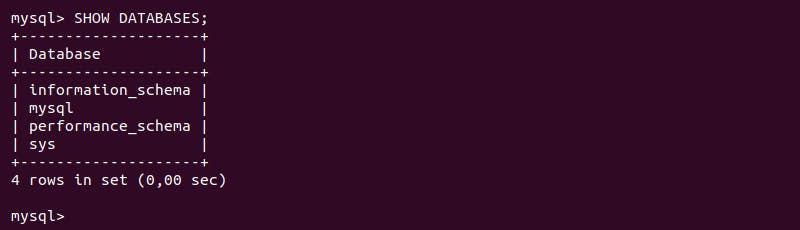
sudo mysqlto go inside the SQL instance. (All perquisites should be downloaded)To check the available database run the command,
show databases. It will show results like below.
Create a new database named "ghost".
mysql > Create database ghost
Create a Remote user for the Ghost Application.
After creating a database, let's create a specific remote user for the ghost application.
Create a new user with a username and password using the following command.
create user ‘ghost_admin’@’%’ IDENTIFIED BY ‘Secret55;The ghost application only supports mysql_native_password. So, alter created user with native_password using the below command.
mysql > alter user ‘ghost_admin’@’%’ IDENTIFIED WITH mysql_native_password ‘Secret55’Give permission to new users for the ghost database only.
mysql> GRANT ALL PRIVILEGES ON ghost. * TO 'ghost_adminr'@'%' WITH GRANT OPTION;Run
select * from users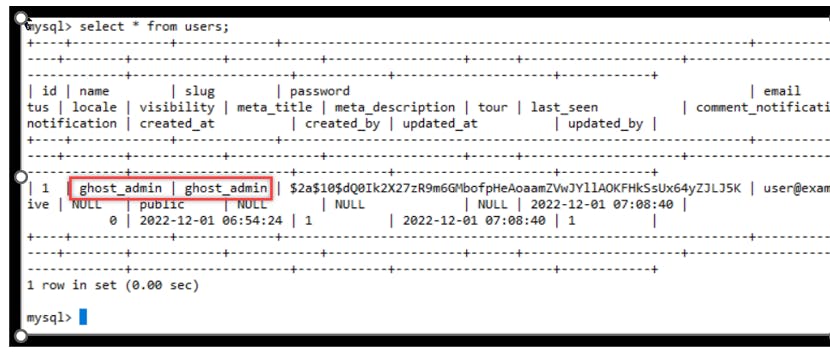
Configure MySQL for remote access.
First, change the directory to edit
mysqld.cnffile.Change directory to
/etc/mysql/mysql.conf.dTo edit
mysqld.cnffile, run the following command.sudo vim mysqld.cnfChange the bind address to
0.0.0.0allow access from any location and then save the file and exit.Actual Output
Change the firewall rule and allow all traffic on
TCP port 3306using below command.sudo ufw allow 3306/tcp.Restart the SQL server to apply above both changes using the below command.
sudo systemctl restart mysql
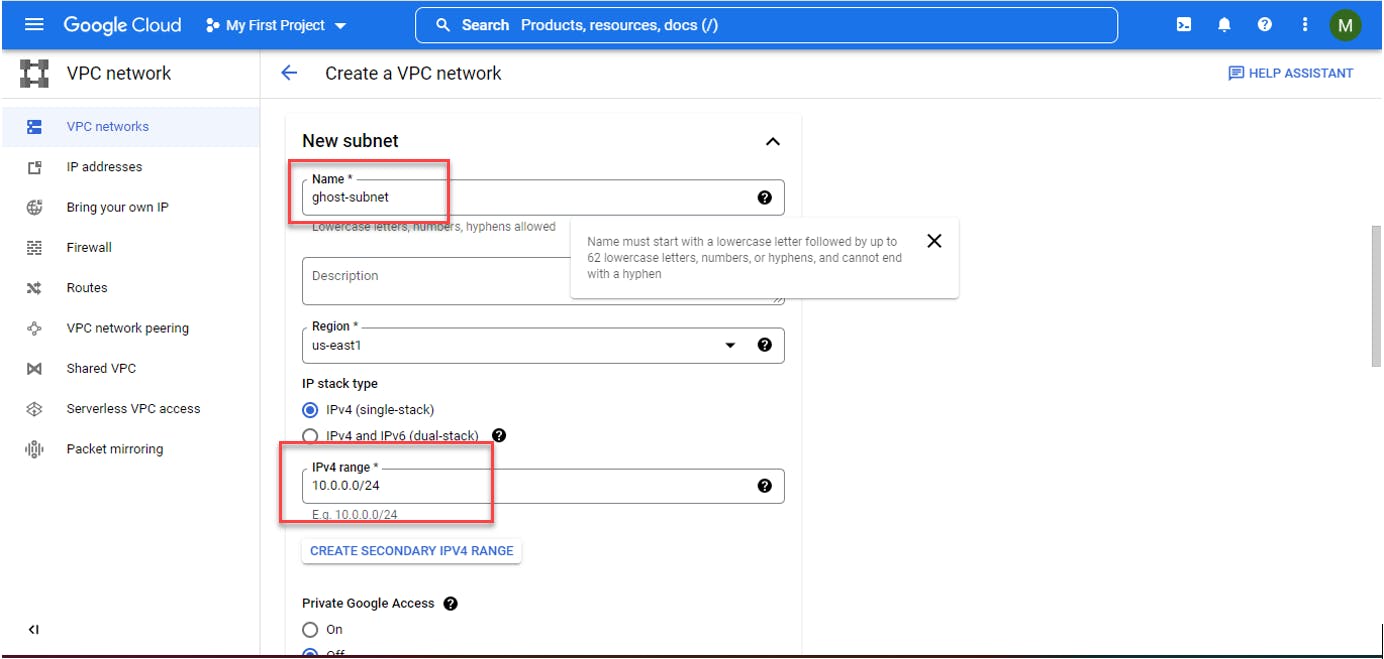
Create a VPC and Subnet on Google Cloud.
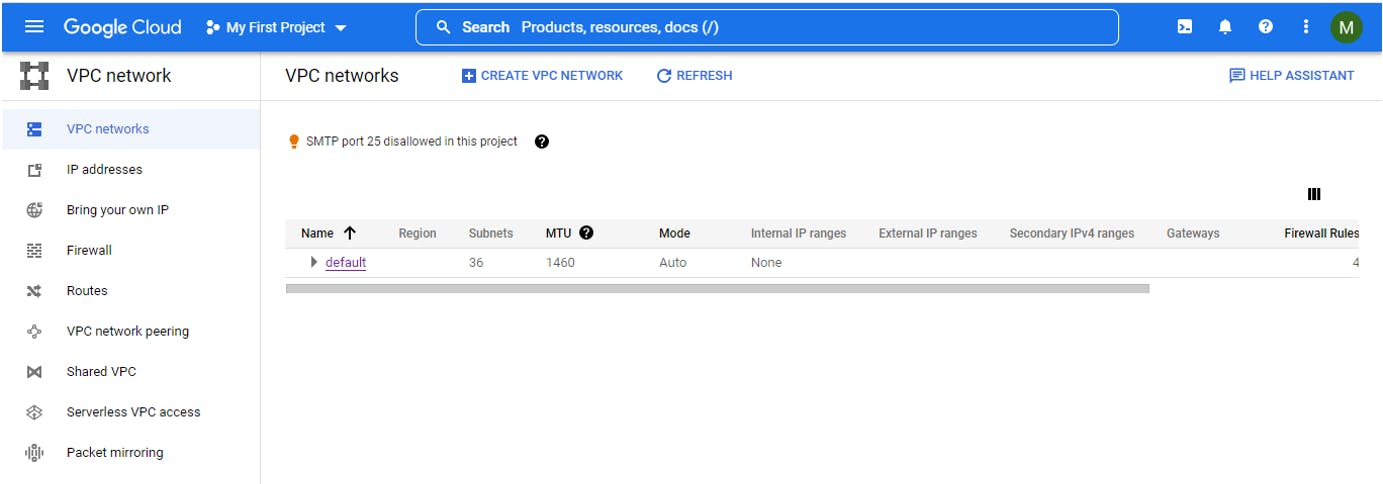
Login into the Google Cloud platform. Go to VPC Network and click on Create VPC Network.
Create a subnet with a name and IP address.
Add the required firewall rule to access the Virtual machine using this virtual private network. As SSH use
tcp port 22, add tcp protocol and22 port numberwhile adding firewall rules.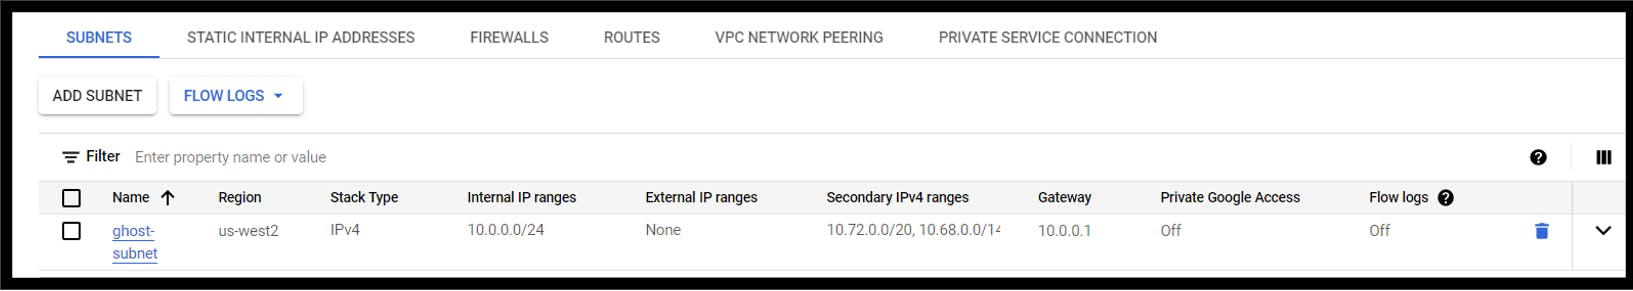
Configure IPsec VPN between GCP and AWS cloud.
Before configuring the VPN on the cloud side its is necessary to get following values from AWS EC2 Network:
Private IP of AWS EC2: 172.31.7.250
Public IP of AWS EC2: 99.79.30.137
Private Subnet: 172.31.0.0 / 16
Open the firewall rules that will allow VPN traffic to Onprem network:
Open the firewall to allow UDP traffic on PORT:
$sudo ufw enable$sudo ufw allow port_no/udp.Get Public interface:
$ip routeChange two values in the sample config Cloud Private Subnet and Interface.
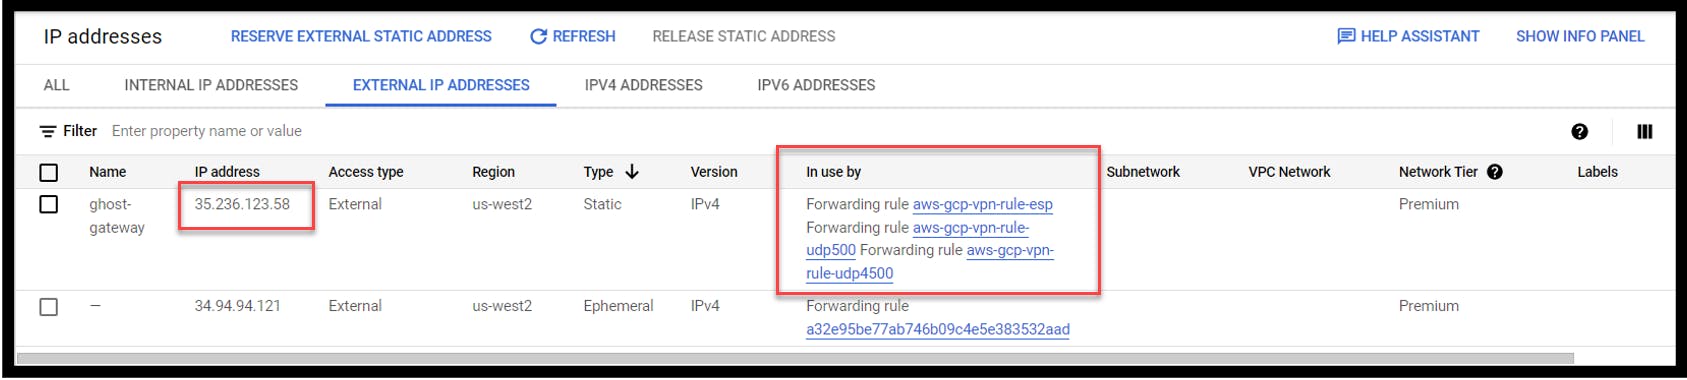
Configure a static ip address in GCP
Goto VPC Network -> External Address -> Reserve IP address
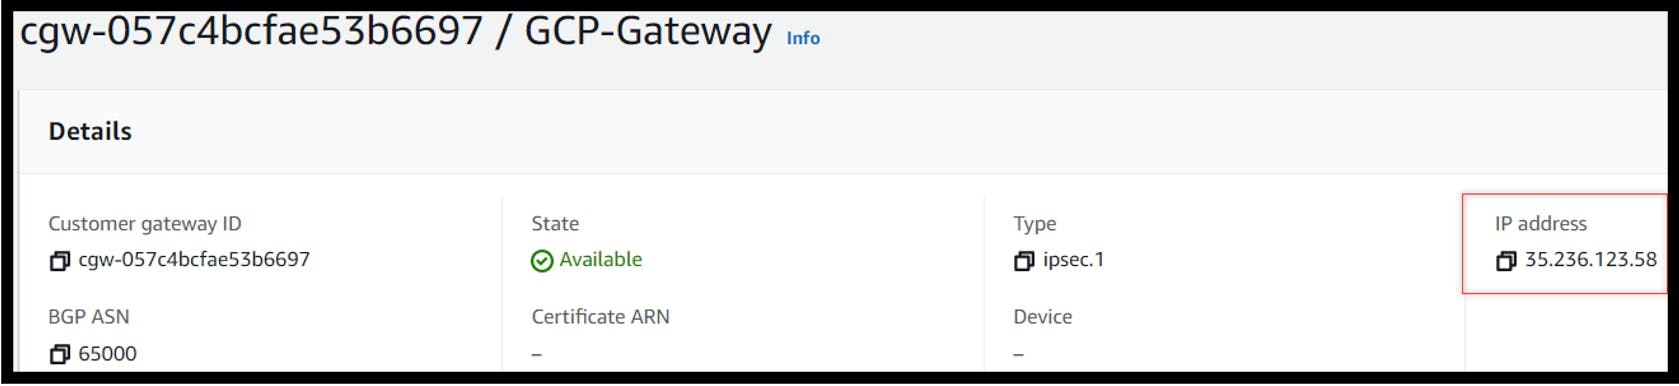
Create a customer gateway in AWS Cloud
Goto VPC -> Customer gateway Enter the static ip address in the only field where we add the ip address from the previous step.
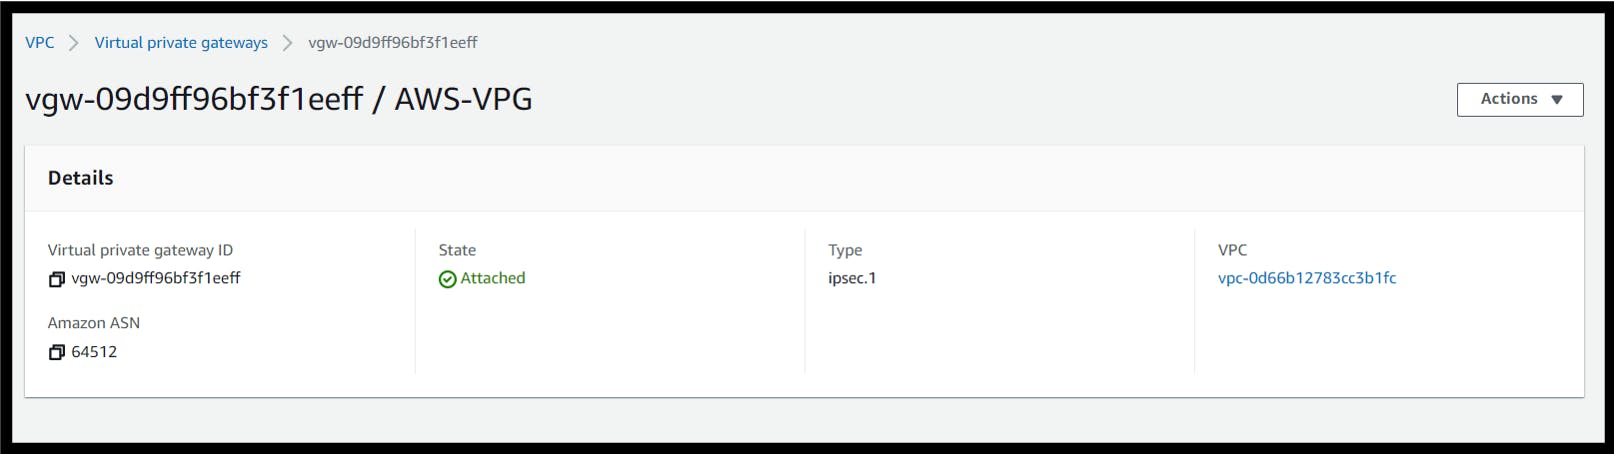
Goto VPC → Virtual Private Gateway → Create a New Virtual Private Gateway and then goto Actions→Attach it to VPC→ Choose the VPC of the on-prem server.
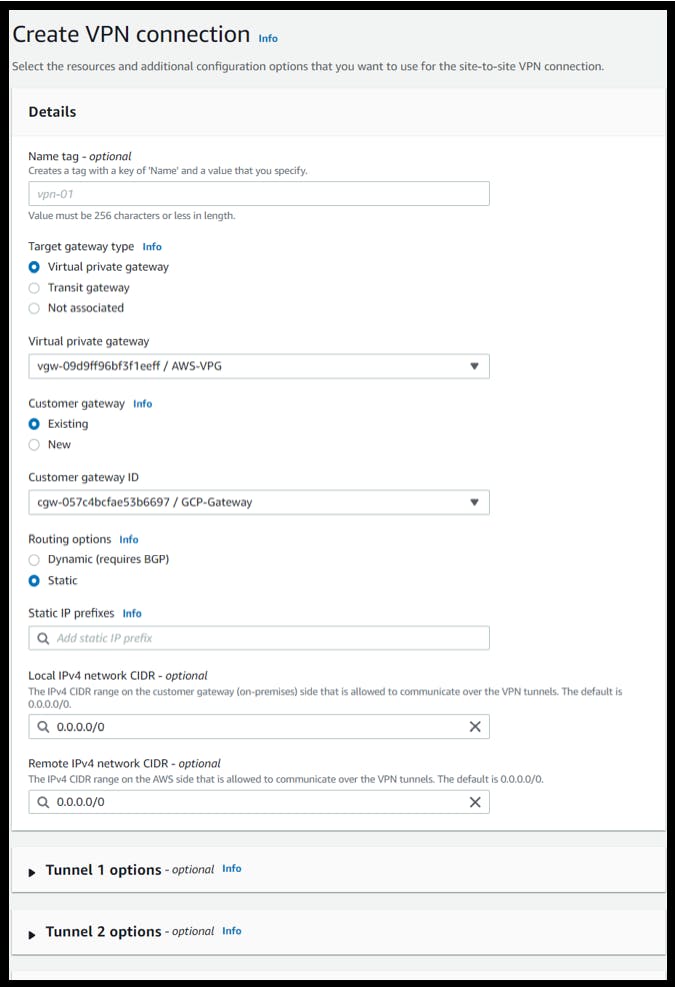
Go to Site to Site VPN in VPC and set up a new Site to Site VPN and enter the following values.
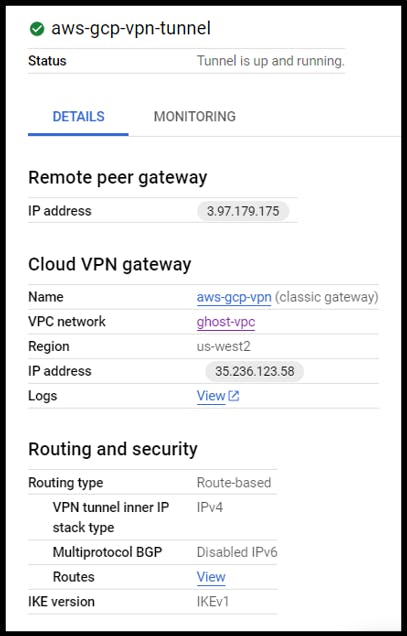
We can see that the VPN Tunnel is up and Running
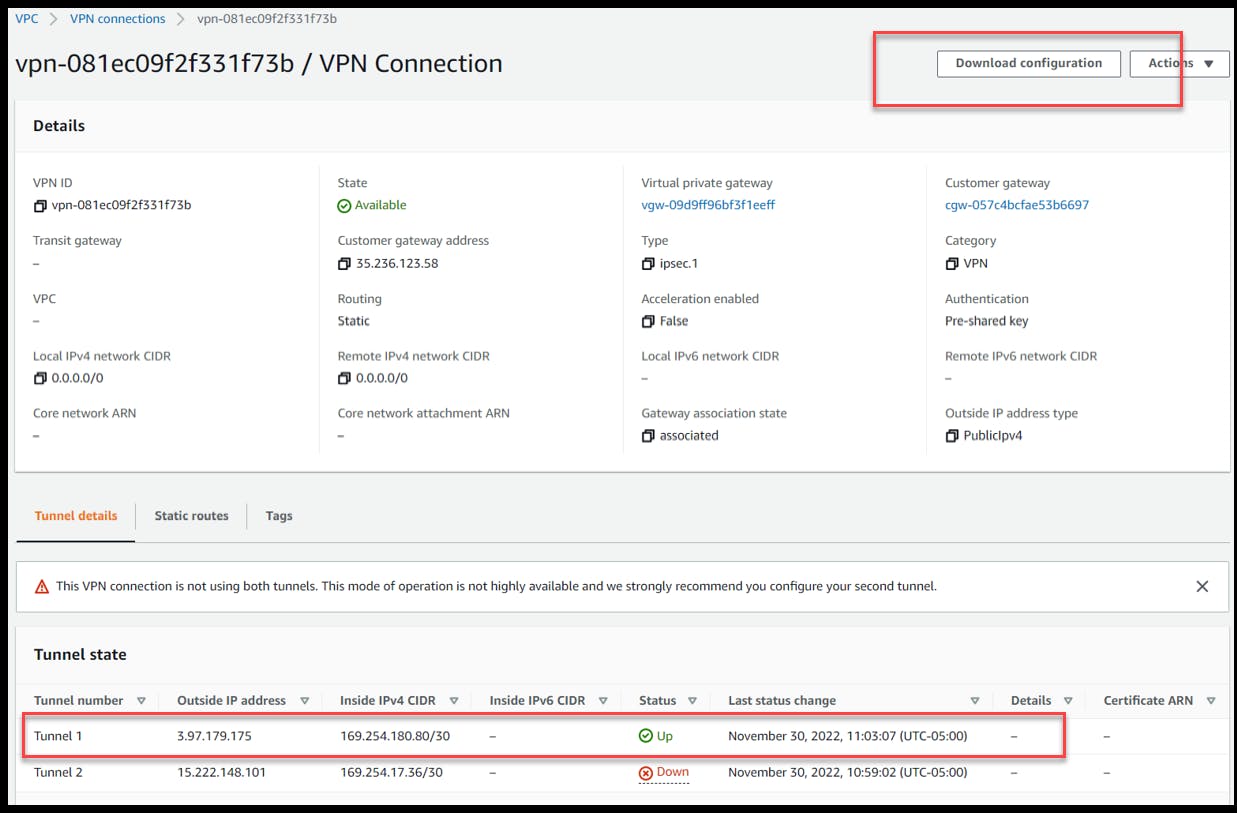
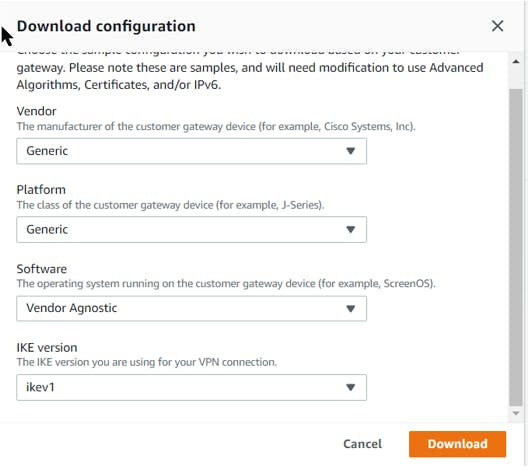
Download the configuration file of this VPN side which will be used later:-
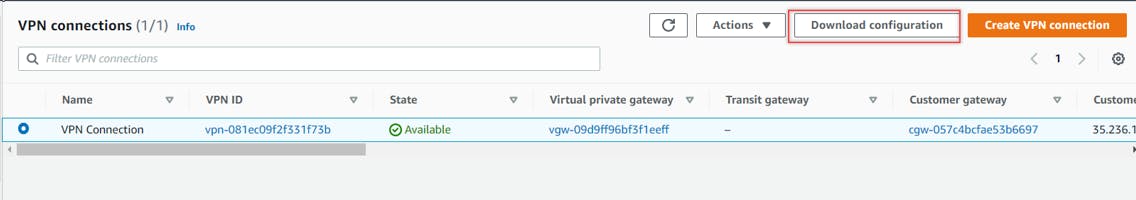
Use the following filter criteria to download the VPN information:-
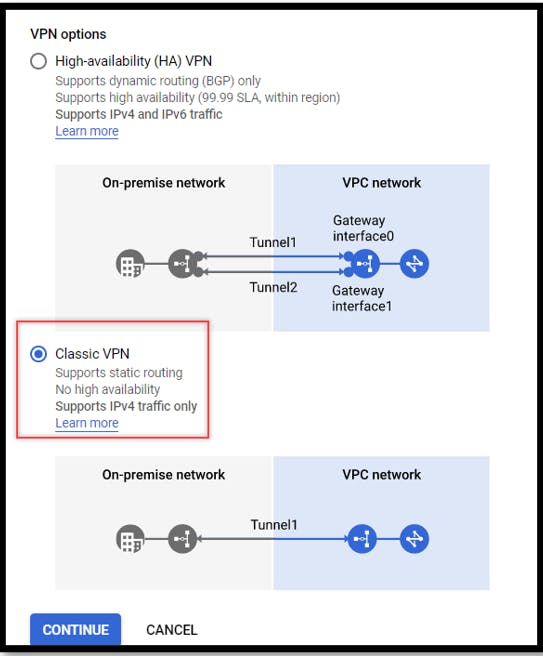
Create a policy-based VPN on the cloud side.
Hybrid Connectivity -> Create VPN -> Entering the name and the required details that we collected earlier-> Creating a tunnel for VPN Connection -> Creating a private subnet to configure the on-prem gateway
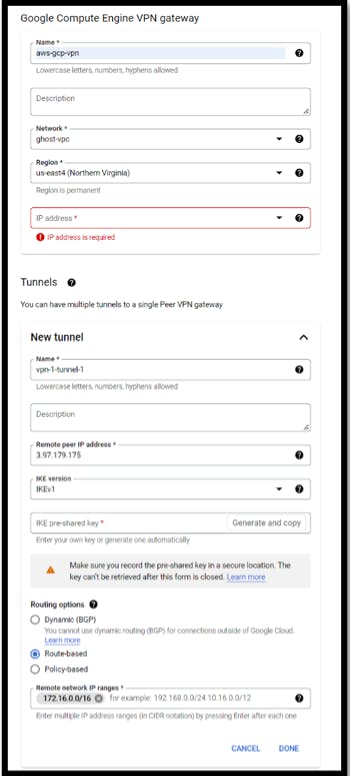
Actual Output :
Create a single node VPC Native GKE Cluster.
Creating a standard configuration Kubernetes cluster with one node and making sure the network gateway is the same as the vpc and vpn that we created.
Enable VPC native traffic routing under networking it will give the port in the cluster a different set of IP Addresses from the date of the cluster.
Using the Ubuntu image to power the Kubernetes Cluster.
Ec2 standard 8 to give power to the application
Create the Kubernetes and select the three dots and connect the Kubernetes using the cloud shell

Create a DNS hostname.
Creating a DNS hostname name using a DNS provider called No IP. Entering the hostname as syst8200 and adding the hostname.

Preparing and publishing our Ghost Helm Chart.
Ghost Helm Chart: https://github.com/bitnami/charts/tree/main/bitnami/ghost
The read-me file gives us lots of information on how to use this helm chat. This way we don't get confused on what to change in order to get a particular feature.
After reading the readme let's clone the above-mentioned GitHub repository on our system.
There are a few values we want to update in our ghost helm chart (values.yaml).
First, make sure that we are using the preferred ghost docker image. Confirm at line 58, we are using the
tag: latestfor the latest image of the Ghost.Enable ingress i.e., in line 414
enabled: trueso our Ghost application can use the Nginx load balancer.Edit the hostname or domain name that will be used by the Ghost application at line 423 (reserved at no-ip).
Lastly, in order to use an external database, the first thing we want to do is to disable MySQL at line 608 using
enabled: false. and then enter the external database connection details (host, port, user, password, and database name) starting from line 649.Now that we have updated all our values, we can go ahead and push our code to a new public GitHub repository (named
ghost-helm-chartfor easier reading).
Deploying Load-Balancer.
Connect to Google Kubernetes Cluster using Google's cloud shell.
Run
helm repo add ingress-nginxkubernetes.github.io/ingress-nginxto add Nginx helm charts to our local helm.Install the Nginx load balancer in our Kubernetes cluster using the command
helm install ingress-nginx ingress-nginx/ingress-enginx.
Installing the Ghost application.
Execute the following command
helm install ghost --set ingress.enabled=true --set ingress.hostname=syst8200.hopto.org --set ghostHost=syst8200.hopto.org --set ghostUsername=ghost_admin --set ghostPassword=Secret55@1234 --set mysql.enabled=false --setexternalDatabase.host=172.31.7.250 --set externalDatabase.port=3306 --set externalDatabase.user=ghost-user --set externalDatabase.password=test --set service.type=LoadBalancer bitnami/ghostTest by opening the web link

Adding DNS record at the domain registrar.
Run
kubectl get ingresscommand in Google Cloud shell to get the public ip of the ghost application.Copy the IP address.
Update the DNS record for the domain name at the registrar using the copied IP address.
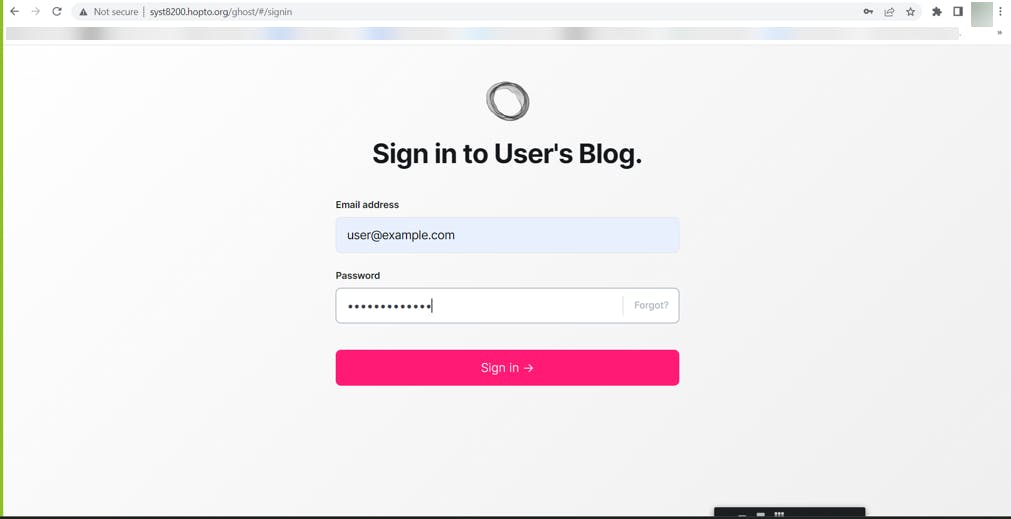
Wait for the DNS to propagate, and open the Ghost application using the domain name provided.
Login to check if the credentials for the admin user are working.
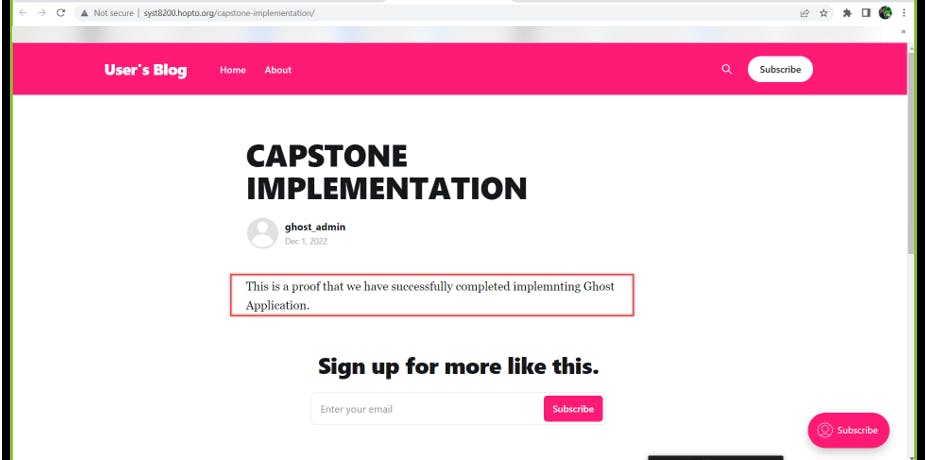
Create a blog to test the working of the Ghost Application.
Visit the blog using the blog URL.
If everything worked, the Ghost application is up and running using the Google Kubernetes Engine.
Spin up a new EC2 on AWS.
This EC2 instance will be used for monitoring, logging, and observability purpose.
Install MySQL on the EC2 instance.
Download and Install The Zabbix Repository.
wget https://repo.zabbix.com/zabbix/6.0/ubuntu/pool/main/z/zabbix-release/zabbix-release_6.0-1+ubuntu20.04_all.deb
dpkg -i zabbix-release_6.0-1+ubuntu20.04_all.deb
apt update
apt search zabbix-server
Install Zabbix Server, Frontend, and Agent.
Execute the following commands to complete this subtask.
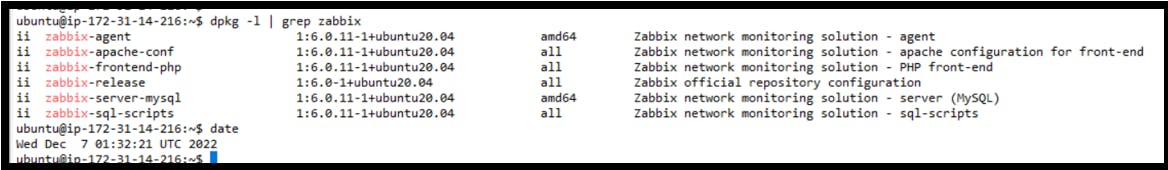
apt install zabbix-server-mysql zabbix-frontend-php zabbix-apache-conf zabbix-sql-scripts zabbix-agent
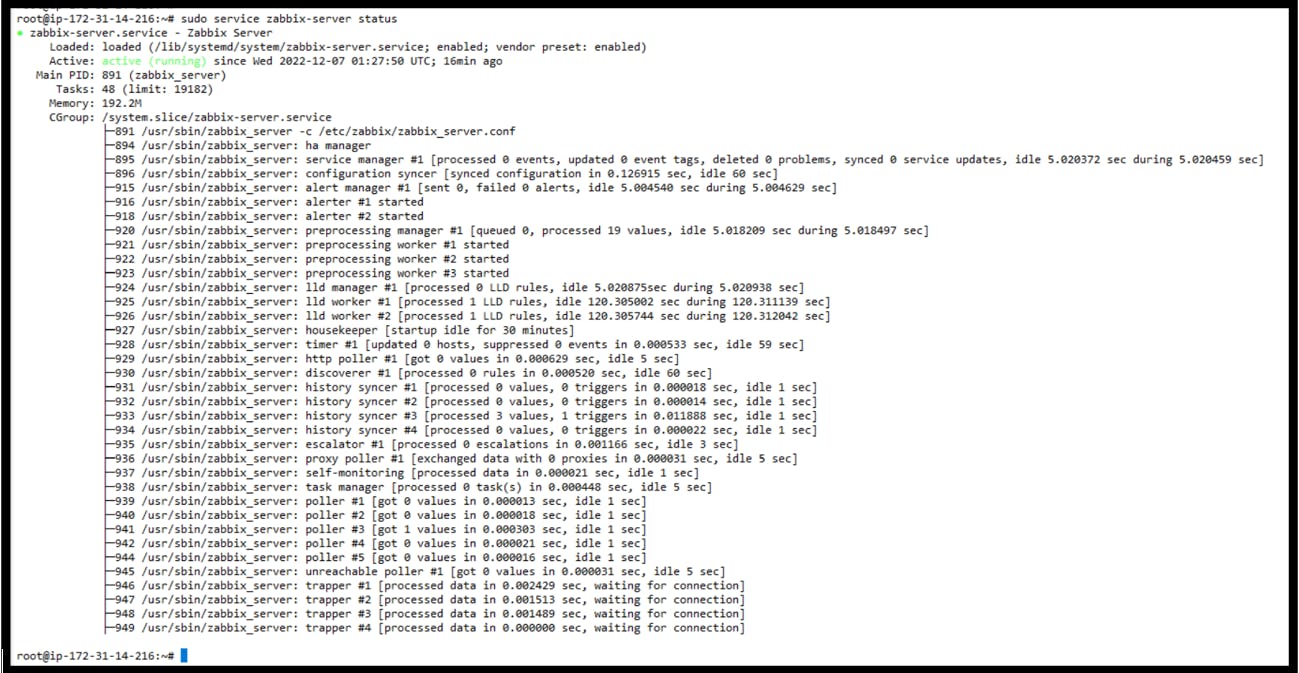
sudo service zabbix-server status
sudo service zabbix-agent status
Actual Output
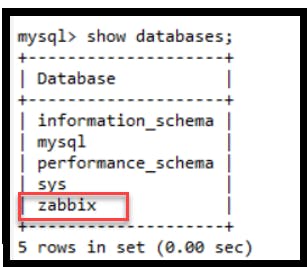
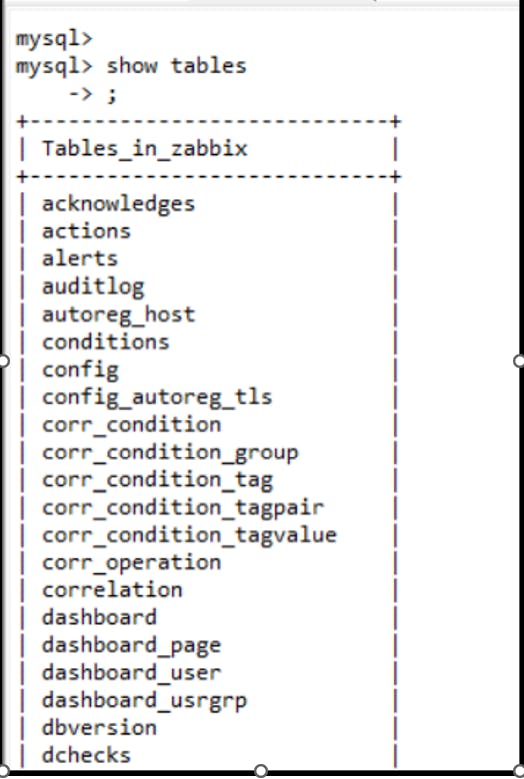
Create an Initial Database.
mysql create database zabbix character set utf8mb4 collate utf8mb4_bin; create user zabbix@localhost identified by 'password'; grant all privileges on zabbix.* to zabbix@localhost; set global log_bin_trust_function_creators = 1; quit;
Import Zabbix Schema:
zcat /usr/share/doc/zabbix-sql-scripts/mysql/server.sql.gz | mysql --default-character-set=utf8mb4 -uzabbix -p zabbix
Disable the log_bin_trust_function_creators option after importing the database schema.
mysql set global log_bin_trust_function_creators = 0; quit;
Edit the Zabbix Server configuration file, hence goto in the Zabbix Server configuration file, find and set the DBPassword property to being the password that you set for your zabbix@localhost user.
sudo vi/etc/zabbix/zabbix_server.conf
DBPassword=password
Start the Zabbix Server Process and refer to the weblink for this subtask if error is encountered.
sudo service zabbix-server start
systemctl enable zabbix-server zabbix-agent apache2
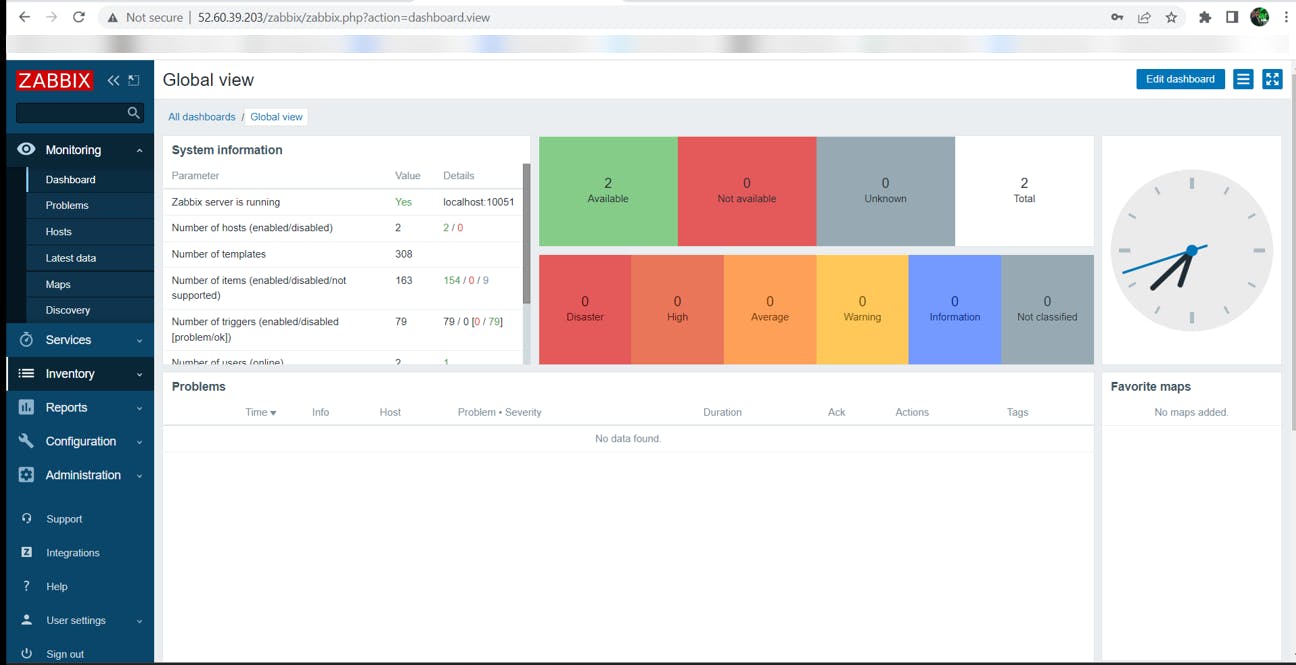
Login and Configure the Zabbix Server Front end.
Execute the following commands to complete this subtask.
sudo service apache2 restart
Enter the credentials: Admin and password as zabbix
Install Zabbix Agent on the same Zabbix Server.
sudo dpkg -i zabbix-release_6.0-1+ubuntu20.04_all.debsudo apt updatesudo apt install zabbix-agentsudo service zabbix-agent restart
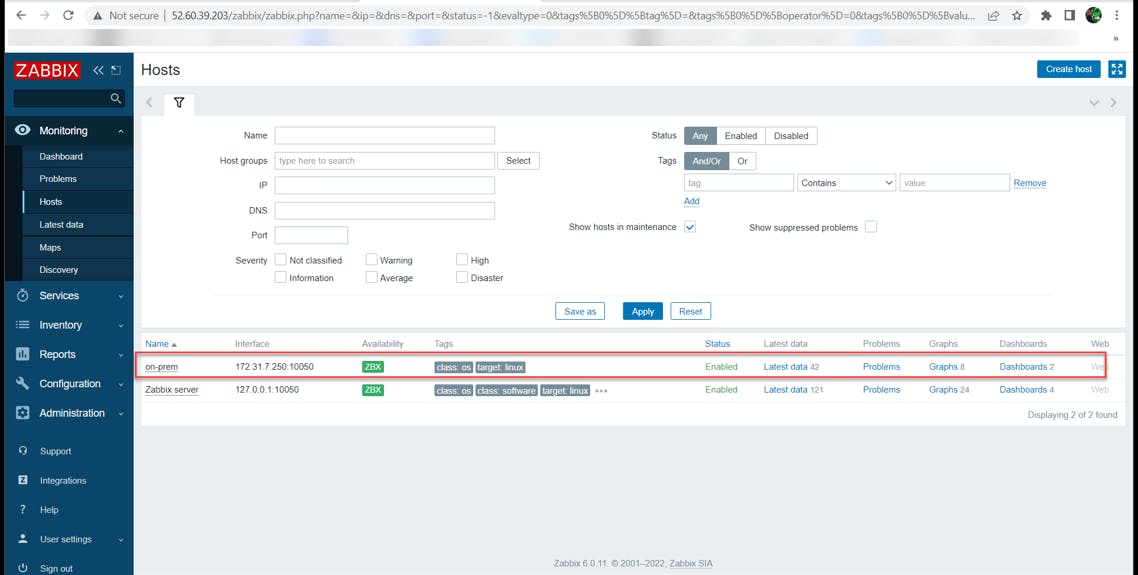
Create host items.
Manually create passive check items.
Go to: Configuration → Hosts
Click on Items in the row of the host
Click on Create item in the upper right corner of the screen
Enter the parameters of the item in the form
Repeat for every host that is needed.
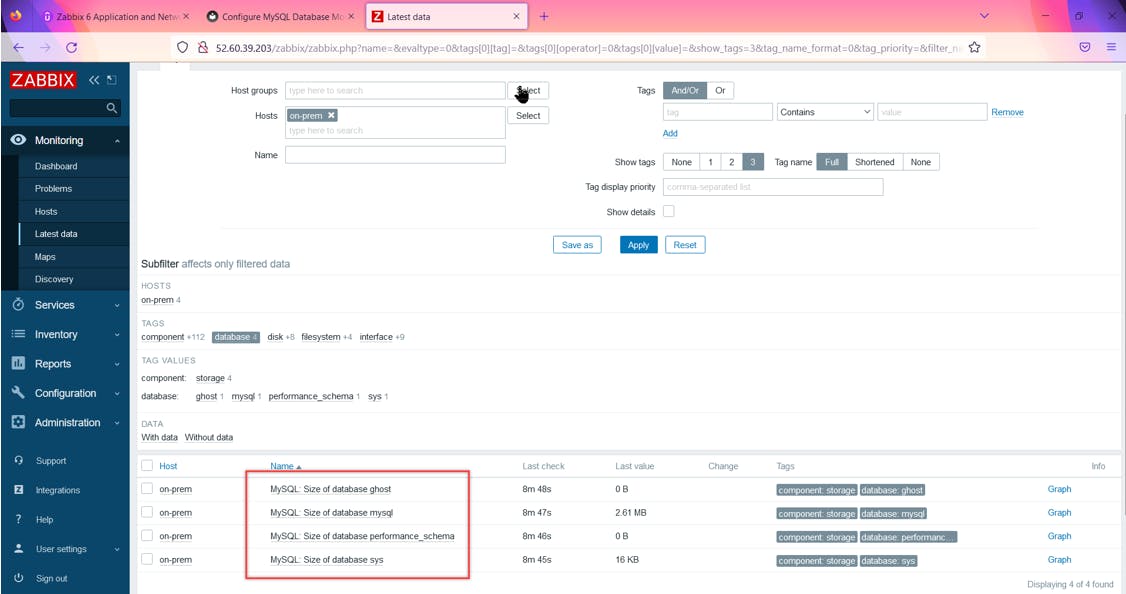
Configure MySQL monitoring.
On the host running MySQL, create a new file in the folder /etc/zabbix/zabbix_agentd.d/ and name it template_db_mysql.conf
sudo vim /etc/zabbix/zabbix_agentd.d/template_db_mysql.conf
Insert:-
UserParameter=mysql.ping[], mysqladmin -h"$1" -P"$2" ping UserParameter=mysql.get_status_variables[], mysql -h"$1" -P"$2" -sNX -e "show global status" UserParameter=mysql.version[], mysqladmin -s -h"$1" -P"$2" version UserParameter=mysql.db.discovery[], mysql -h"$1" -P"$2" -sN -e "show databases" UserParameter=mysql.dbsize[], mysql -h"$1" -P"$2" -sN -e "SELECT COALESCE(SUM(DATA_LENGTH + INDEX_LENGTH),0) FROM INFORMATION_SCHEMA.TABLES WHERE TABLE_SCHEMA='$3'" UserParameter=mysql.replication.discovery[], mysql -h"$1" -P"$2" -sNX -e "show slave status" UserParameter=mysql.slave_status[*], mysql -h"$1" -P"$2" -sNX -e "show slave status"
Enter the MySQL shell and create a new user called zbx_monitor and grant it the required permissions for the database server.
CREATE USER 'zbx_monitor'@'localhost' IDENTIFIED BY ''; GRANT USAGE,REPLICATION CLIENT,PROCESS,SHOW DATABASES,SHOW VIEW ON . TO 'zbx_monitor'@'localhost';
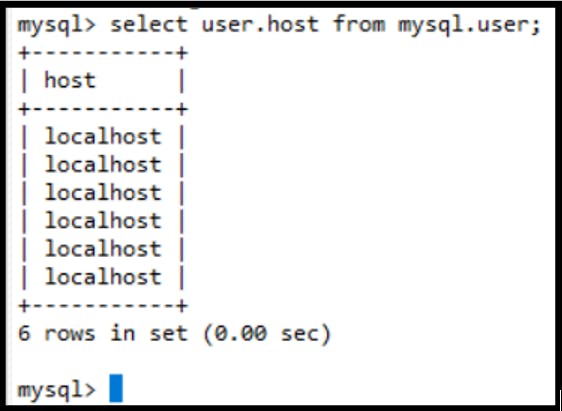
To verify the databases that your user has been added to, you can type
select user,host from mysql.user;
Install Grafana and configure it to interface it with Zabbix.
Run the following commands on Zabbix Server.
sudo apt-get install -y adduser libfontconfig1
wget https://dl.grafana.com/oss/release/grafana_8.5.2_amd64.deb
sudo dpkg -i grafana_8.5.2_amd64.deb
sudo service grafana-server start
Open port 3000 so that Grafana UI could be accessed.
Your Grafana server will be hosted at :- http://<IP address>:3000
To interface the Zabbix with Grafana
The Zabbix is data source & it already has the data in time-series format.
Once you login into Grafana, go the Configuration.
Click on Plugin --> Add Plugin --> Search for Zabbix Plugin
Click on Configuration -->Datasource --> Click on Zabbix
Click on Settings & enter the URL field in the HTTP block:- "Zabbix_Hostname/zabbix/api_jsonrpc.php
Go to Zabbix & Create a Zabbix user.
Administration-->Users--> Create User.
Provide Username & Password.
Select a user group as per your requirement.
Assign permissions through the permissions tab, (usually it should automatically populate as per the selected user group). Make sure you select the hosts.
Make sure that the "Access to API" is enabled.
Create.
Come back to Grafana User Interface, at the same previous step 5
Enter the username & password which we created in Zabbix (Step 7-12) in the Grafana's tab of username & password.
Save & Test
Green Promt will appear on the screen displaying the API version which means that the connectivity to Zabbix is successful.
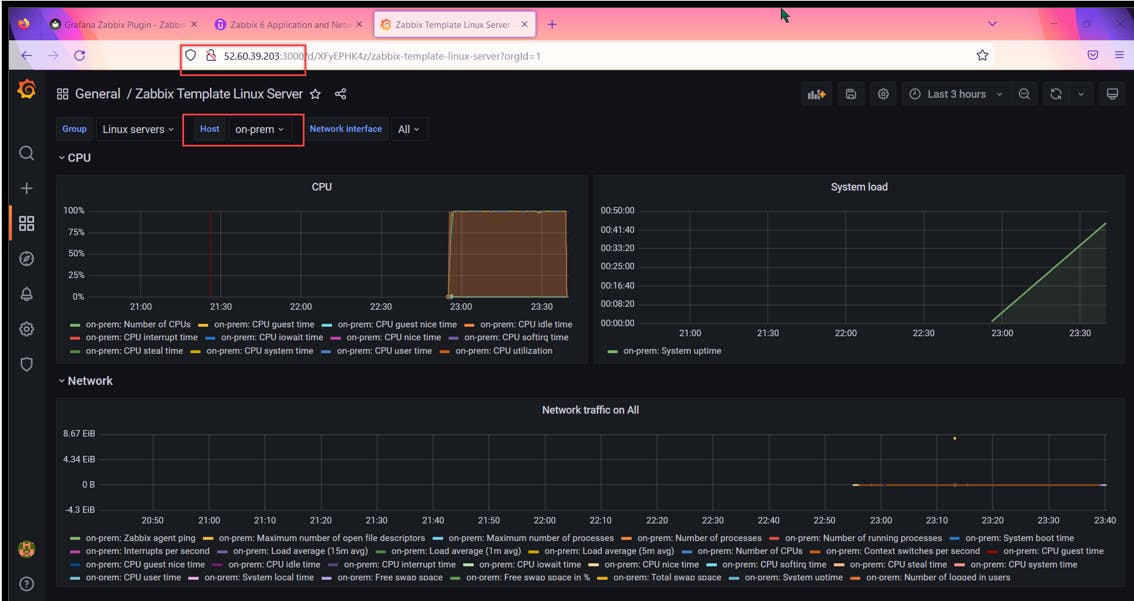
Now go to the "Dashboards" tab in the configurations itself & import the existing 3 dashboards.
Now go the main Dashboards section & you will see the data.
Once your Grafana is installed you can optionally create the dashboards as per your requirements.
A more detailed blog on Grafana would be published soon.
Now that you have come reading all the way down, consider this as a personal thank you for taking out your time and reading my blog, if you attempt to build this you could learn about how a multi-cloud environment operates, some of the features were knowingly chosen to save some bucks (like single tier VPN) just as this is a conceptual understanding and not a full proof production environment, let's keep learning and keep growing !!!!
Reference
[1].Ghost Organization.(n.d).Ghost.https://ghost.org/
[2].Kubernetes Authors.(n.d).Kubernetes.https://kubernetes.io/
[3].Docker Inc.(n.d). Docker.https://docs.docker.com/get-docker/
[4].strongSwan.org.(n.d).strongSwan.https://www.strongswan.org/
[5].Helm Authors.(n.d).Helm.https://helm.sh/
[6].Pitchkites, M. (2022, June 2). Google One VPN Review 2022. VPNoverview.com. https://vpnoverview.com/vpn-reviews/google-one-vpn/
[7].Gilbert Sam | SRE & Cloud Infrastructure. (2022, October 17). Deploy applications on Cloud Architecture with devops tools. Udemy. Retrieved November 7, 2022, from https://www.udemy.com/course/deploy-application-on-a-hybrid-cloud-using-google-kubernetes
[8].Bradley, S. (n.d.). Zabbix 6 application and network monitoring. Udemy. Retrieved November 7, 2022, from https://www.udemy.com/course/zabbix-monitoring
[9]. Grafana Labs. (2019). Grafana - The open platform for analytics and monitoring. Grafana Labs. https://grafana.com/
[10]. Free Dynamic DNS - Managed DNS - Managed Email - Domain Registration - No-IP. (n.d.). Www.noip.com. https://www.noip.com/
[11]. Site-to-Site VPN Between GCP and AWS Cloud. (n.d.). Www.linkedin.com. https://www.linkedin.com/pulse/site-to-site-vpn-between-gcp-aws-cloud-aslam-chandio/